
Our mission at Strata Cloud Accountants is to help business owners and operators make better decisions. In that spirit, I’d like to focus on using, interpreting, and taking advantage of the two most common Financial Reports: the Profit and Loss Balance Sheet and Income Statement.
What is a Balance Sheet and Income Statement, and how are the reports related?
The Balance Sheet is a snapshot in time, showing a complete picture of “what you have” and “how you paid for it.” See the example “BALANCE SHEET ANALYSIS” report and the first column in the report “Now” (highlighted in blue).
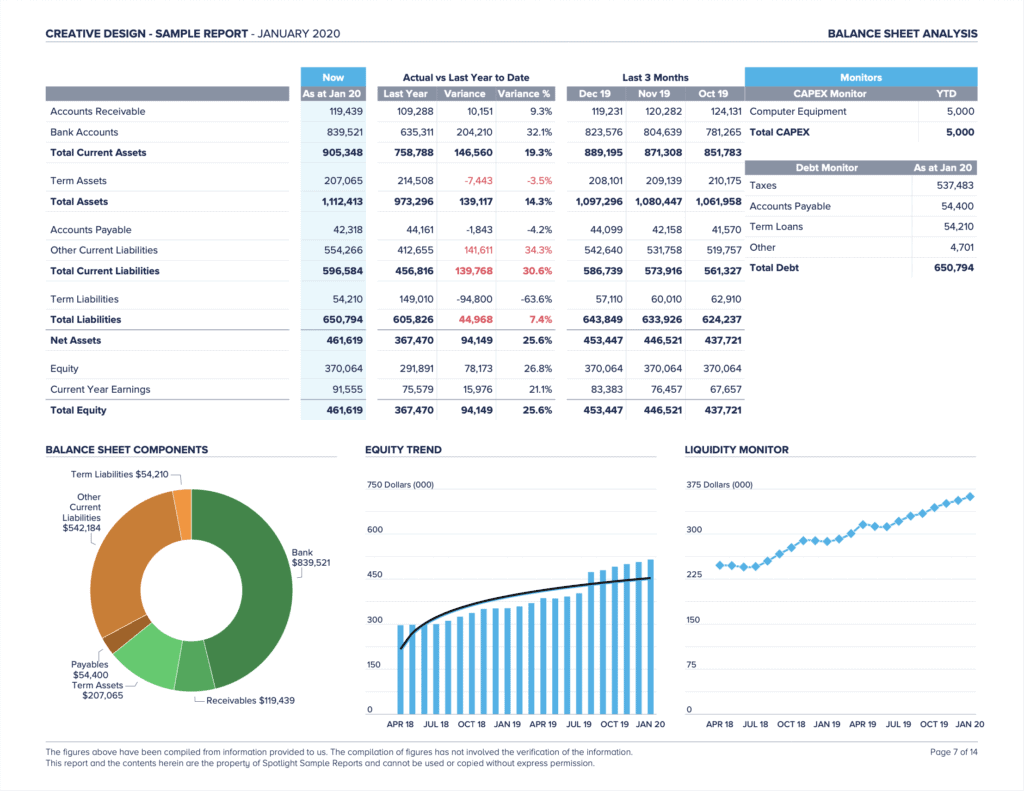
This column shows the company position as of “Now” (Jan 2020 in this example). In other words, if you took a picture of “what you have (Total Assets)” and “how you paid for it (Total Liabilities + Total Equities)” as of right now, the first column is that picture. So “what you have” is about $905k in current assets (cash, inventory) and $207k in Long-term assets (equipment, furniture, building), “how you paid for it” is about $650k in loans (Total Liabilities), $370k in equity (a combo of owners’ cash contributions and prior years’ earnings), and $91.5k in current fiscal year earnings. “What you have” (Total Assets) and “how you paid for it” (Total Liabilities + Total Equity) always match, because you have to explain every owned asset with how it was purchased (either a loan, cash contribution, or with earnings from business operations (net profit)).
An Income Statement (also known as a Profit & Loss Report, both terms are used interchangeably) shows a company’s performance over time. See the example “PROFIT AND LOSS ANALYSIS” report. Each column shows performance over a specific time period.
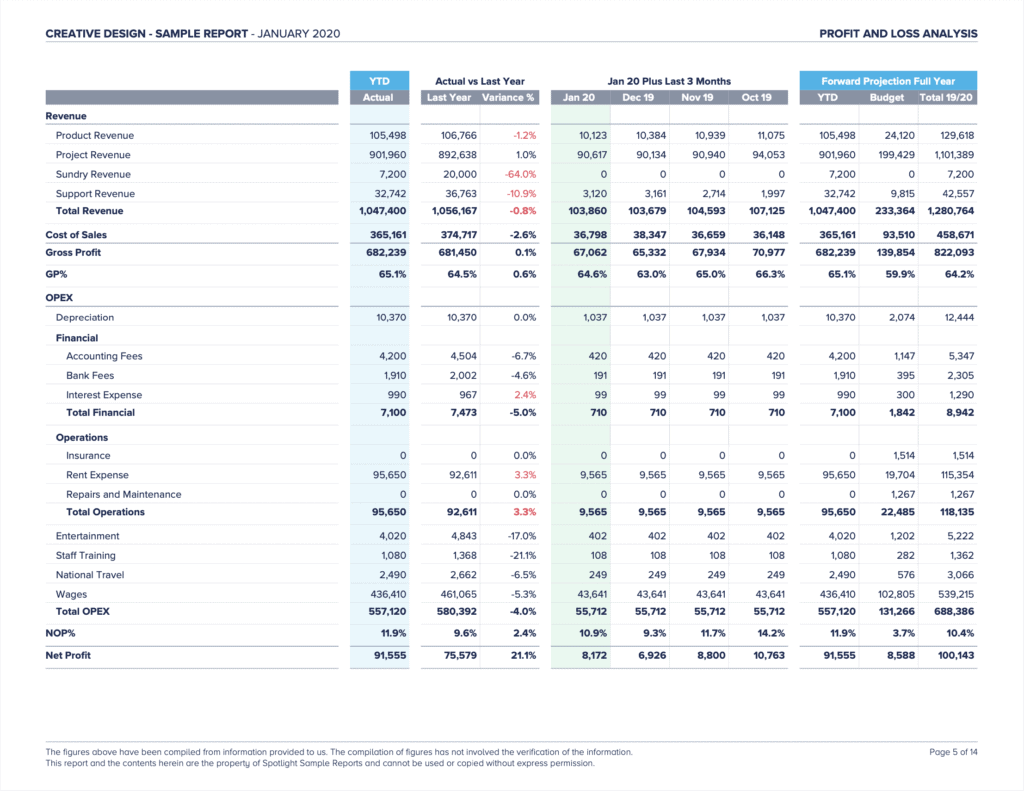
The columns titled “Jan 20”, “Dec 19″… “Oct 19” for instance, are showing operating results within each month (starting the first day of the month and ending the last day of the month). If you added “Jan 20” to “Oct 19” columns together, you’d get combined operating results for the last four months. On a high level, the components of the Income Statement are intuitive and straightforward: Revenue (recognized cash inflows) – Expenses (recognized cash outflows) = Net Profit (aka Net Income or the money the business gets to keep). There is much more that could be written regarding the Income Statement; however, I’ll save that for another blog post 😉
The Income Statement is a part of the Balance Sheet. Looking at the “PROFIT AND LOSS ANALYSIS” report’s “YTD” (year-to-date) column, you will see that the bottom-line Net Profit is $91,555. If you now move to the “BALANCE SHEET ANALYSIS” report, you’ll notice Current Year Earnings (part of Total Equity) is the exact same number $91,555. Remember that Current Year Earnings is part of the “how you paid for it” section of the Balance Sheet, so you can think of the Income Statement as opening the book on Current Year Earnings and seeing the line-by-line detail of precisely what happened in business operations to make up the $91,555 in this case.
Interpreting and Taking Advantage of a Balance Sheet and Income Statement
Compare different periods, to see trends over time.
If you notice in the “PROFIT AND LOSS ANALYSIS” report, the different columns are different periods. You can see month vs. month, month vs. YTD, current YTD vs. prior YTD, plus variance percentage, and a combined actual vs budget column area. These different periods presented side by side are incredibly useful because they all tell a story in relation to each other. For instance, in this case, month by month and this year vs. last year’s comparisons are incredibly consistent in terms of revenue. This could mean everything is tracking as expected (a positive), or it could mean that the company missed expectations on a new service launch, maintaining steady sales while expecting a sharp jump in the last two months (a negative). Either way, the numbers side-by-side should start the conversation by providing an apples-to-apples measure of the current and prior period’s relative performance.
Look at the data in different ways using Grouping, Charts, and Graphs.
Sometimes seeing the data in graphical or chart form can provide fresh insight or inspire a new question. Suppose you notice the three graphs at the bottom of the “BALANCE SHEET ANALYSIS” report. In that case, you can see that cash & receivables make up about 1/2 of the balance sheet, equity is trending upward, and liquidity is also increasing. These are all great trends that will not be available looking at just one balance sheet (snapshot in time) alone, however taking data from balance sheets throughout previous periods, you can start to see these trends. Once again, seeing these graphs should start building and then help to answer questions such as “are we most efficiently using our cash?”, “do we have enough cash currently to buy a new building space”, “can we pay down a portion of the short-term high-interest loan we took out last year?”
Consider where you’re going and the decisions you face in the future.
When viewing the Balance Sheet and Income Statement, always keep your company vision and desired direction for the business in mind. For example, you may be interested in moving into a different product or service line, but it will take more materials and labor per package sold compared to your existing products. Looking at your businesses’ latest Income Statement, you can see that the company is just breaking even on the bottom line Net Income for year-to-date. This could start a focused conversation on the best timing for adding the new products, how aggressively you should pursue the strategy, and whether there is ample cash to weather a lower margin in future months.
Let these reports be a conversation starter, not the ultimate decision-maker.
As the business owner or operator, you must utilize the financial results to make decisions; however, the Balance Sheet and Income Statement are only one part of the puzzle. Financial Reports are meant to expose questions, start business direction conversations, and highlight areas to dig deeper. Acting rashly in response to financial results alone can actually miscast blame, alienate employees and lead to profit-decreasing activities. However, if these Financial Reports are combined with operational expertise and understanding of desired business direction, then they provide a more precise and accurate map to “steer the ship” toward greater profitability.
All these suggested techniques and financial report presentations to take full advantage of the Balance Sheet and Income Statement are available to you each month with Strata Cloud Accountants! See your future monthly reports here.
By Kyle Smith, CPA