
I’ve talked in previous blog posts about Dynamic Forecasting, and how it is different from a standard budget. In this post, we will revisit that topic but focus instead on what makes up a Forecasting Report and why it is so valuable to you!
A Forecasting Report is split into 3 main sections:
- The Profit & Loss Budget
- The Projected Balance Sheet
- The Projected Cash Flow Statement
1) The Profit & Loss (P&L) Budget
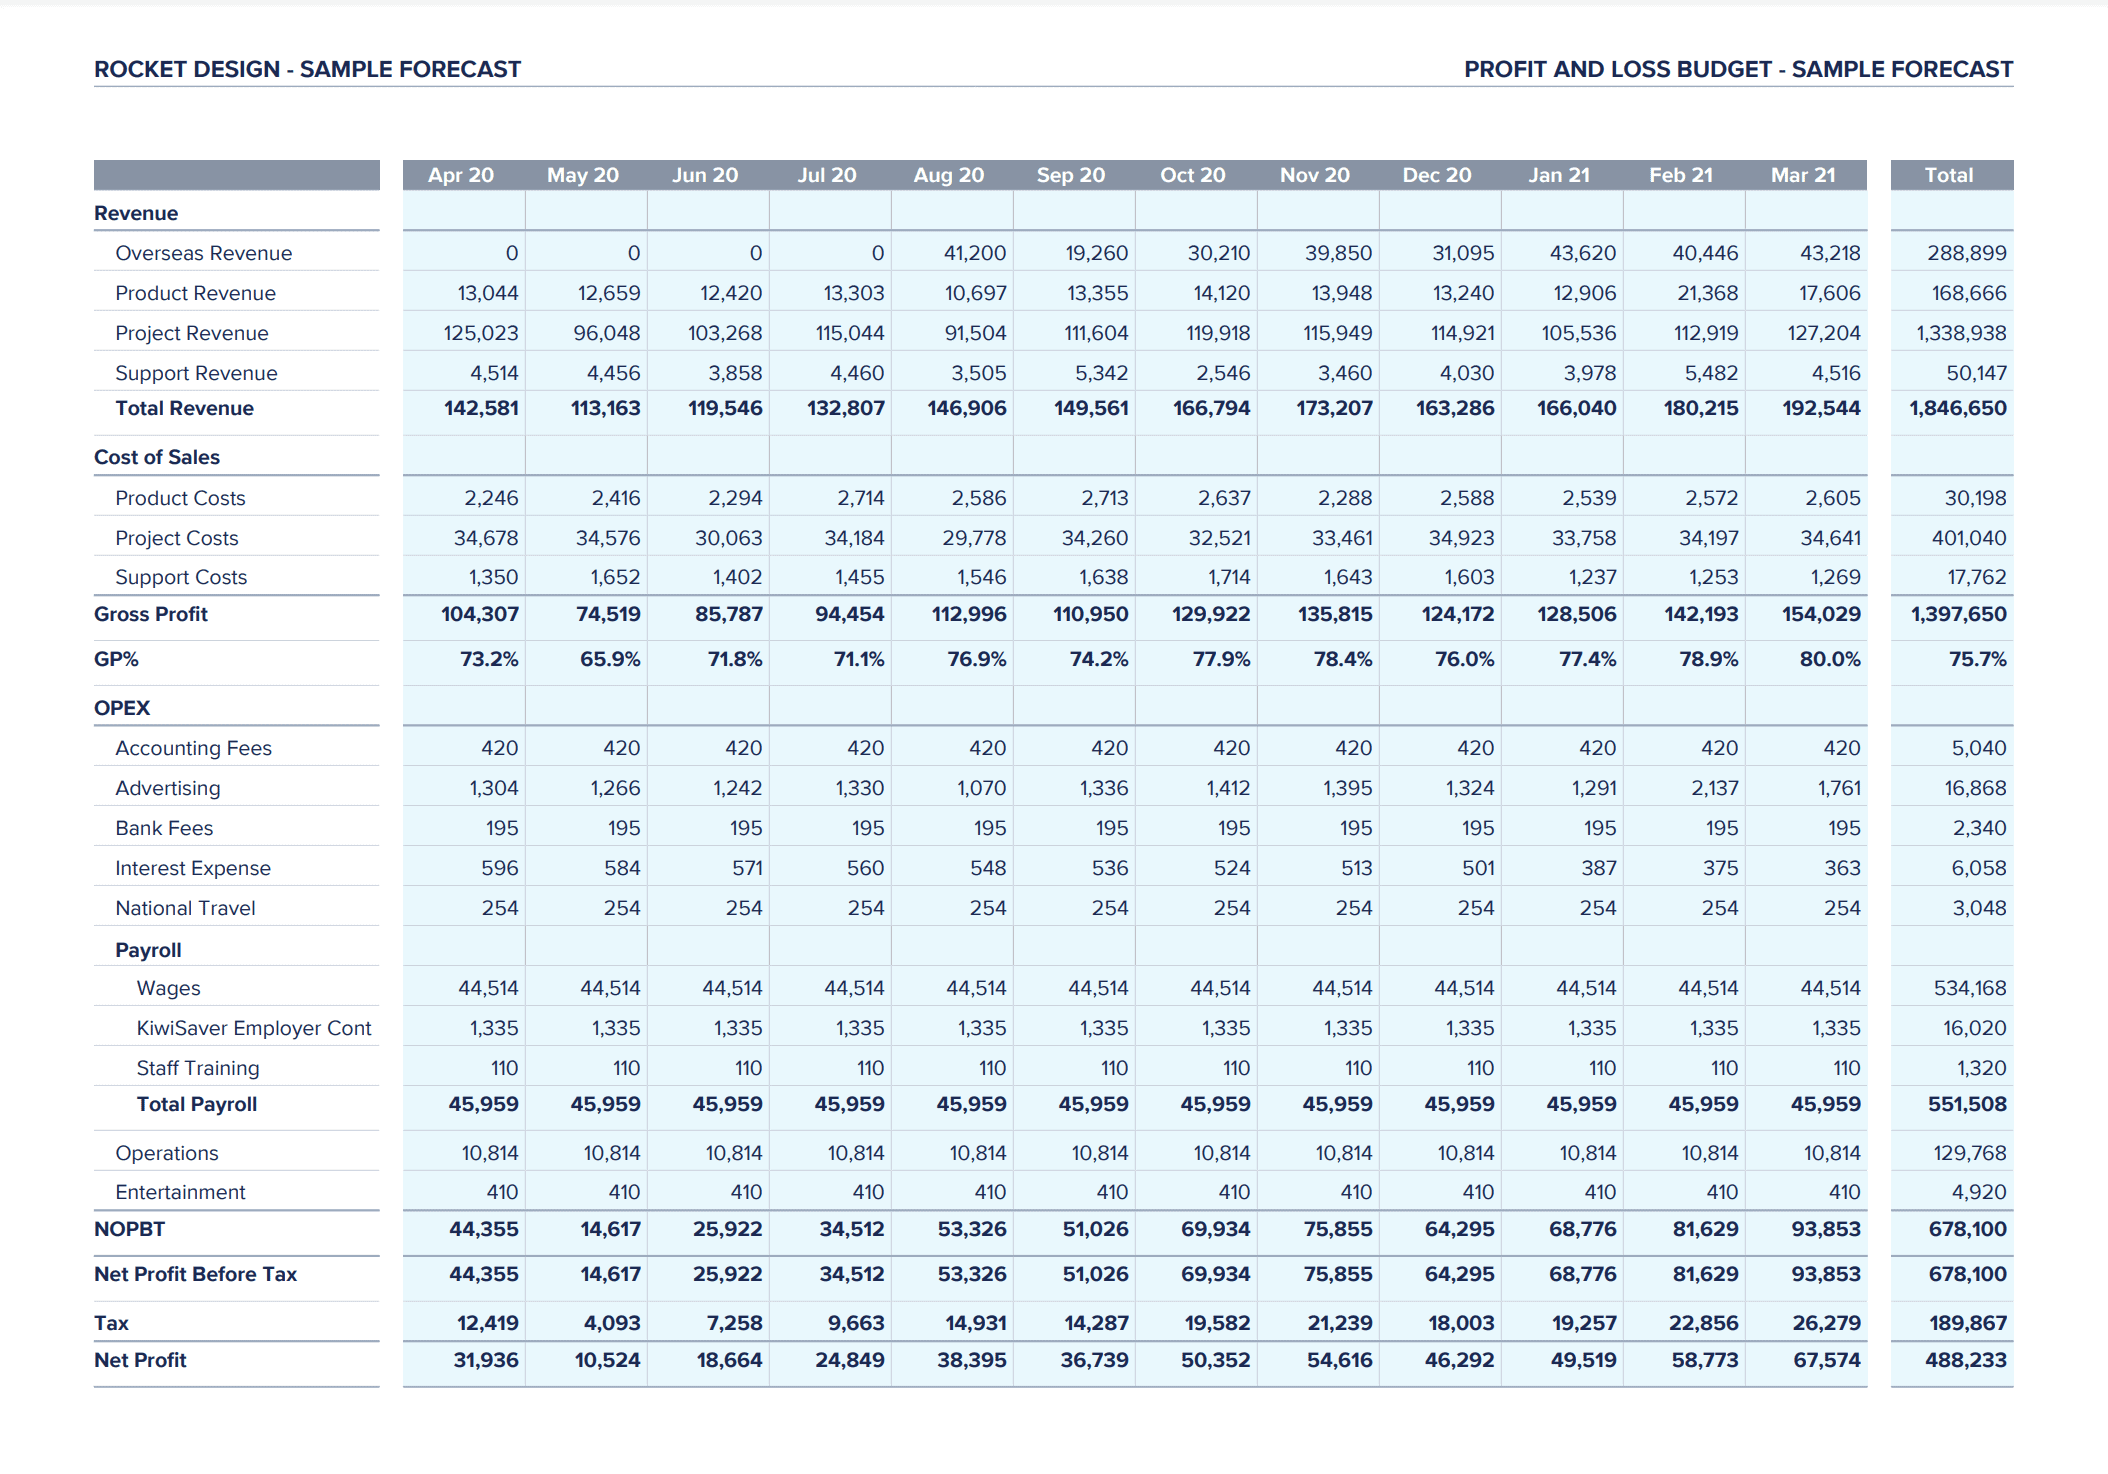
The P&L Budget is the first part of a financial forecast and is the standard budget that people are familiar with. This budget includes all revenues, expenses and predicts future bottom line Net Income for a set period (usually a fiscal year or rolling 12-months).
The P&L Budget is so valuable because it includes an apples-to-apples, month-by-month projection of operating results that you can then compare to existing results. This gives you the ability to quickly spot trends, identify unexpected costs, or address unprofitable months. In other words, the P&L budget gives you the ability to refine your operating plan and direction for the upcoming months.
2) The Projected Balance Sheet
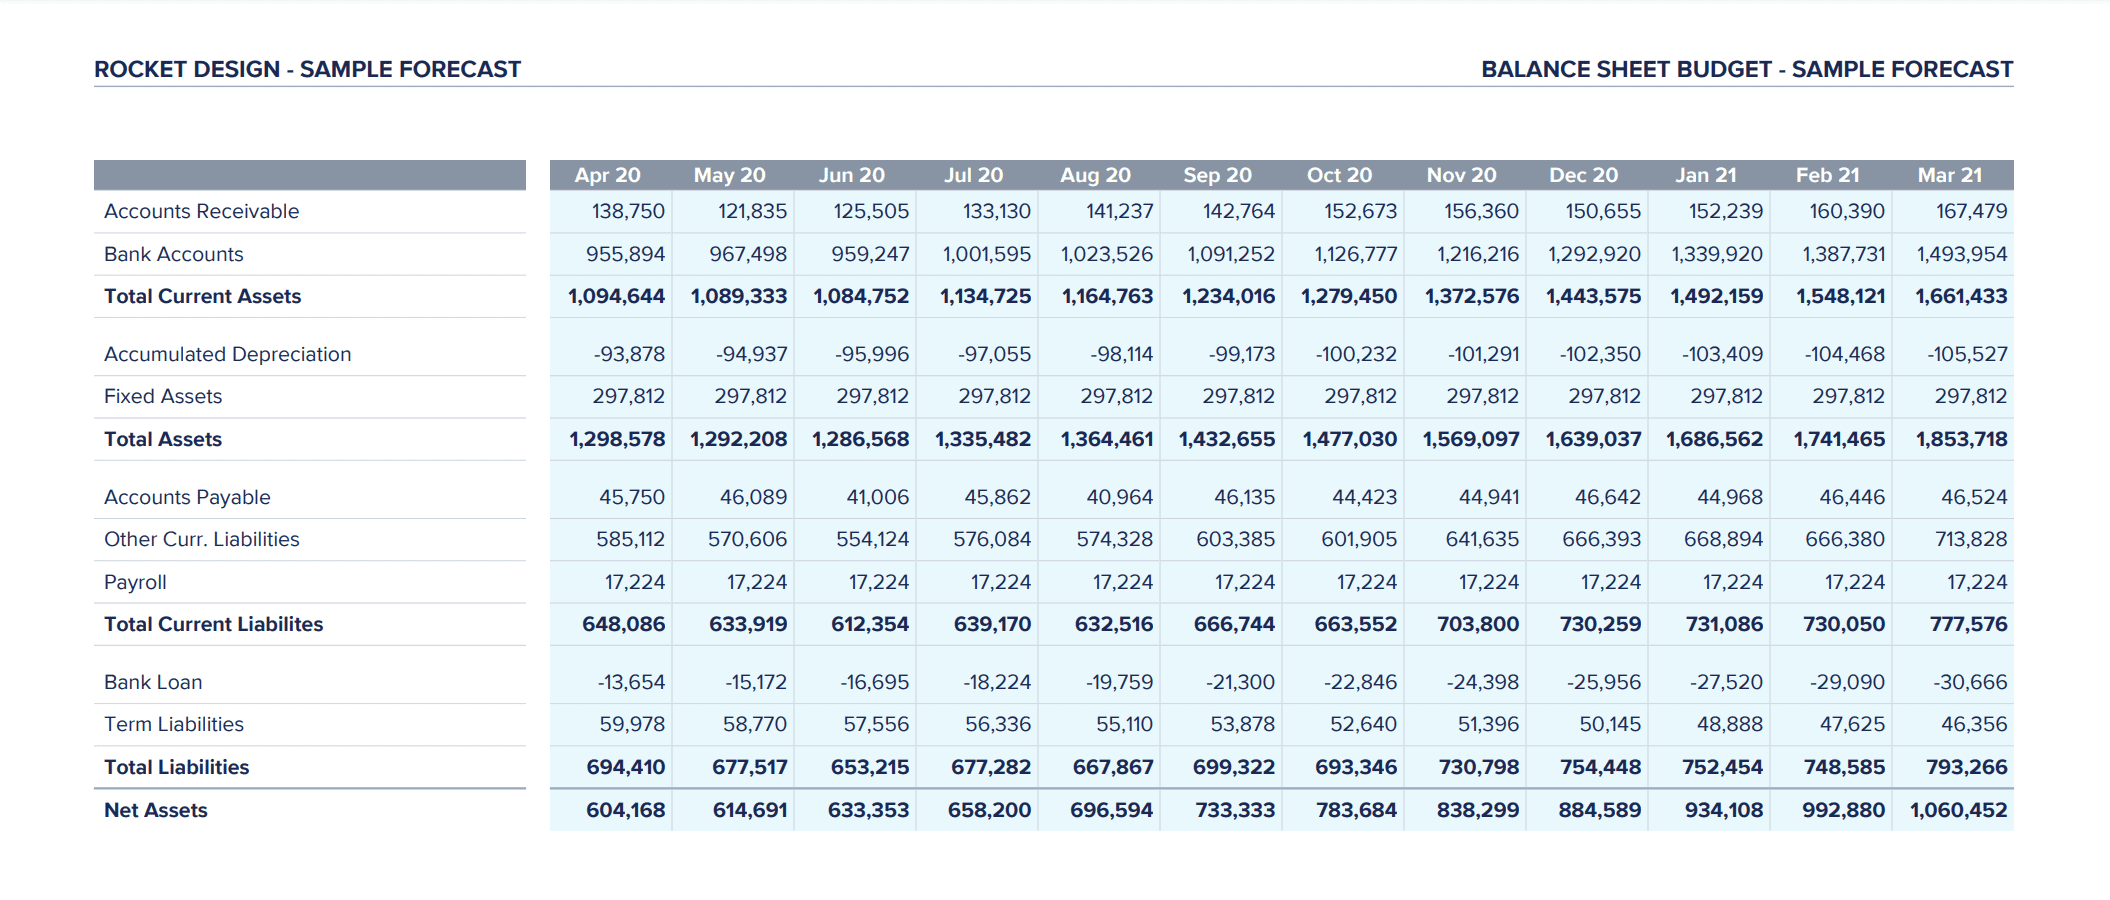
The Balance Sheet projection is simply the month-ending account balances of the business for the projected period. For instance, a 12-month Balance Sheet Projection would show projected month-by-month account balances (including projected Net Income from the Balance Sheet), side-by-side for the year.
This side-by-side ending account projection is valuable because it provides a quick at-a-glance at the projected state of the business throughout the forecast period. You can see how the overall debt load is trending for the year, or perhaps see how a large equipment purchase in the next quarter affects your total asset picture.
3) The Projected Cash Flow Statement
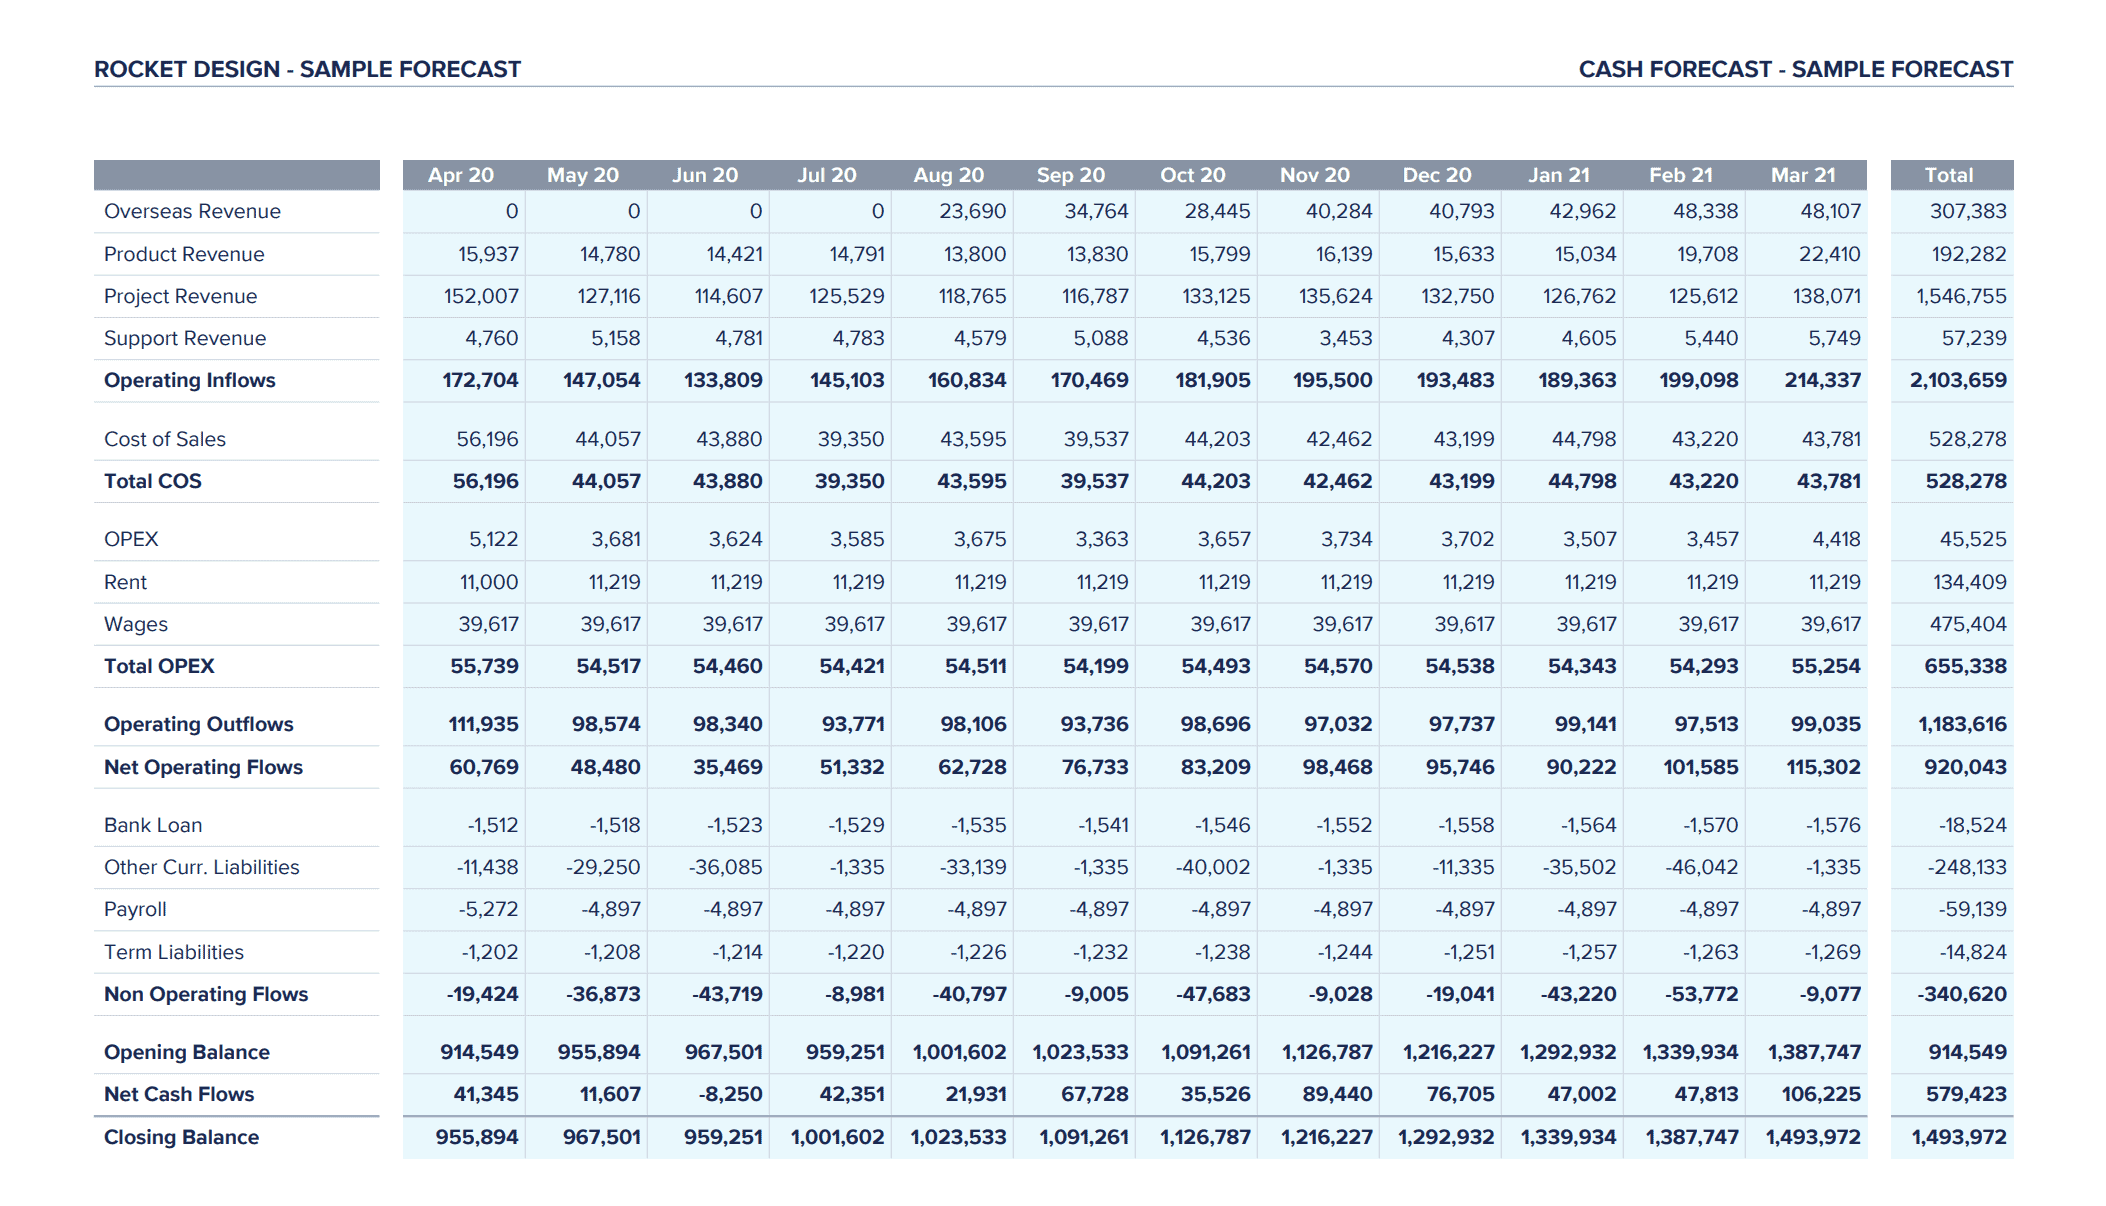
The Projected Cash Flow Statement is a month-by-month, side-by-side projection of all cash movements for the forecast period, culminating in total cash in the bank at each projected month-end. So the bottom line projected cash shown by month in this report must match the corresponding projected bank balances on the Balance Sheet projection.
This is perhaps the most powerful and underutilized section of a forecast. While the P&L (Profit & Loss) Budget can show projected operating results, the projected Cash Flow Finance Statement gets right down to brass tax and shows bottom-line cash impact.
For example, say you needed that big piece of equipment referenced above to achieve aggressive projected revenue growth for the next 2 quarters. So you plug the equipment into assets on the balance sheet, but now on the projected Cash Flow, it shows that this asset purchase will cause your cash-in-bank to go negative next quarter (before you can rake in the projected increased revenues). In this case, you could consider financing the asset, show your lender the Projected P&L results, then plug the loan schedule back into your original Forecast to show updated month-by-month projected Cash Flow. That is why a full Forecast including a Cash Flow projection is so powerful; instead of just showing a part (i.e. just a budget), it can show you the entire picture so that you can make the best decisions for your business.
Summary
So, to summarize everything we just said into one short and sweet sentence: A full Forecasting Report is the most powerful because it shows you the entire financial picture so that you can make the best decisions for your business.
If you want to get deeper insights into your business’ finances, connect with us here at Strata Cloud today to get started!
By Kyle Smith, CPA